
Page 141 - Understanding NCERT Science 09
P. 141
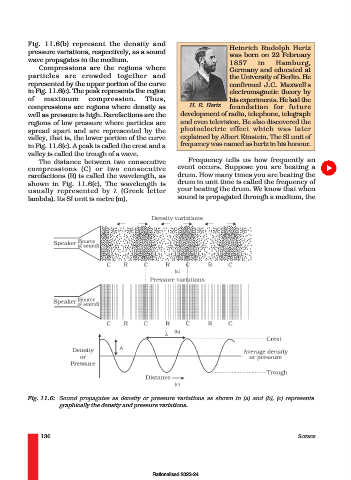
Fig. 11.6(b) represent the density and
                                                                                Heinrich Rudolph Hertz
              pressure variations, respectively, as a sound
                                                                                was born on 22 February
              wave propagates in the medium.
                                                                                1857     in    Hamburg,
                 Compressions are the regions where                             Germany and educated at
              particles are crowded together and                                the University of Berlin. He
              represented by the upper portion of the curve                     confirmed J.C. Maxwell’s
              in Fig. 11.6(c). The peak represents the region                   electromagnetic theory by
              of   maximum        compression.      Thus,                       his experiments. He laid the
              compressions are regions where density as            H. R. Hertz  foundation for future
              well as pressure is high. Rarefactions are the    development of radio, telephone, telegraph
              regions of low pressure where particles are       and even television. He also discovered the
              spread apart and are represented by the           photoelectric effect which was later
              valley, that is, the lower portion of the curve   explained by Albert Einstein. The SI unit of
              in Fig. 11.6(c). A peak is called the crest and a  frequency was named as hertz in his honour.
              valley is called the trough of a wave.
                 The distance between two consecutive             Frequency tells us how frequently an
              compressions (C) or two consecutive              event occurs. Suppose you are beating a
              rarefactions (R) is called the wavelength, as    drum. How many times you are beating the
              shown in Fig. 11.6(c), The wavelength is         drum in unit time is called the frequency of
              usually represented by λ      (Greek letter      your beating the drum. We know that when
              lambda). Its SI unit is metre (m).               sound is propagated through a medium, the


             Fig. 11.6: Sound propagates as density or pressure variations as shown in (a) and (b), (c) represents
                        graphically the density and pressure variations.


                  130                                                                                 SCIENCE


                                                       Rationalised 2023-24