
Page 50 - Understanding Economics for Class 10
P. 50
24. The following table gives the GDP in Rupees (Crores) by the three sectors:
Year Primary Secondary Tertiary
2000 52,000 48,500 1,33,500
2013 8,00,500 10,74,000 38,68,000
Goyal Brothers Prakashan
(i) Calculate the share of the three sectors in GDP for 2000 and 2013.
(ii) Show the data as a bar diagram similar to Graph 2 in the chapter.
(iii) What conclusions can we draw from the bar graph?
Ans. (i) Share in GDP (in percentage)
Year Primary Secondary Tertiary
2000 22.3 20.7 57
2013 13.94 18.7 67.36
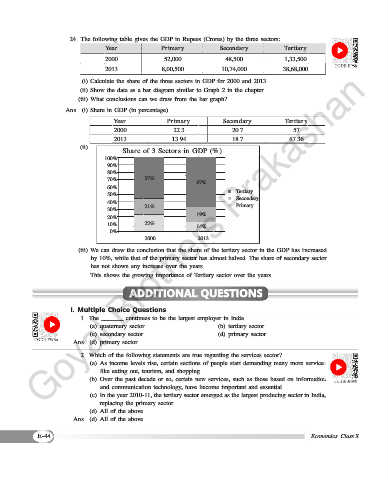
(ii)
Share of 3 Sectors in GDP (%)
100%
90%
80%
70% 57% 67%
60% Tertiary
50% Secondary
40% Primary
30% 21%
20% 19%
10% 22% 14%
0%
2000 2013
(iii) We can draw the conclusion that the share of the tertiary sector in the GDP has increased
by 10%, while that of the primary sector has almost halved. The share of secondary sector
has not shown any increase over the years.
This shows the growing importance of Tertiary sector over the years.
ADDITIONAL QUESTIONS
i. multiple choice Questions
1. The _______ continues to be the largest employer in India.
(a) quaternary sector (b) tertiary sector
(c) secondary sector (d) primary sector
Ans. (d) primary sector
2. Which of the following statements are true regarding the services sector?
(a) As income levels rise, certain sections of people start demanding many more services
like eating out, tourism, and shopping.
(b) Over the past decade or so, certain new services, such as those based on information
and communication technology, have become important and essential.
(c) In the year 2010-11, the tertiary sector emerged as the largest producing sector in India,
replacing the primary sector.
(d) All of the above.
Ans. (d) All of the above.
E-44 Economics Class X