Page 89 - Understanding NCERT Science 09
P. 89

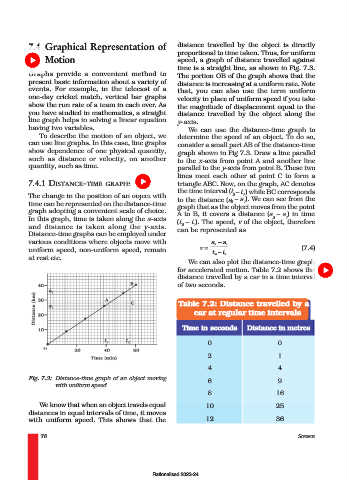
7.4 Graphical Representation of                  distance travelled by the object is directly
                                                               proportional to time taken. Thus, for uniform
                   Motion                                      speed, a graph of distance travelled against
                                                               time is a straight line, as shown in Fig. 7.3.
              Graphs provide a convenient method to            The portion OB of the graph shows that the
              present basic information about a variety of     distance is increasing at a uniform rate. Note
              events. For example, in the telecast of a        that, you can also use the term uniform
              one-day cricket match, vertical bar graphs       velocity in place of uniform speed if you take
              show the run rate of a team in each over. As     the magnitude of displacement equal to the
              you have studied in mathematics, a straight      distance travelled by the object along the
              line graph helps in solving a linear equation    y-axis.
              having two variables.                               We can use the distance-time graph to
                 To describe the motion of an object, we       determine the speed of an object. To do so,
              can use line graphs. In this case, line graphs   consider a small part AB of the distance-time
              show dependence of one physical quantity,        graph shown in Fig 7.3. Draw a line parallel
              such as distance or velocity, on another         to the x-axis from point A and another line
              quantity, such as time.                          parallel to the y-axis from point B. These two
                                                               lines meet each other at point C to form a
              7.4.1 DISTANCE–TIME GRAPHS                       triangle ABC. Now, on the graph, AC denotes
                                                               the time interval (t – t ) while BC corresponds
              The change in the position of an object with     to the distance (s – s ). We can see from the
                                                                                    1
                                                                                 2
                                                                                    1
                                                                                2
              time can be represented on the distance-time     graph that as the object moves from the point
              graph adopting a convenient scale of choice.     A to B, it covers a distance (s – s ) in time
              In this graph, time is taken along the x–axis    (t – t ). The speed, v of the object, therefore
                                                                                                  1
                                                                                              2
              and distance is taken along the y-axis.           2   1
                                                               can be represented as
              Distance-time graphs can be employed under
              various conditions where objects move with                  s 2  – s 1
              uniform speed, non-uniform speed, remain                v =                              (7.4)
                                                                          t  – t
              at rest etc.                                                 2  1
                                                                  We can also plot the distance-time graph
                                                               for accelerated motion. Table 7.2 shows the
                                                               distance travelled by a car in a time interval
                                                               of two seconds.
                                                               Table 7.2: Distance travelled by a
                                                                    car at regular time intervals

                                                                Time in seconds       Distance in metres

                                                                         0                      0
                                                                         2                      1

                                                                         4                      4
              Fig. 7.3: Distance-time graph of an object moving          6                      9
                       with uniform speed
                                                                         8                     16
                  We know that when an object travels equal             10                     25
              distances in equal intervals of time, it moves
              with uniform speed. This shows that the                   12                     36

                  78                                                                                  SCIENCE


                                                       Rationalised 2023-24
   84   85   86   87   88   89   90   91   92   93   94