
Page 91 - Understanding NCERT Science 09
P. 91
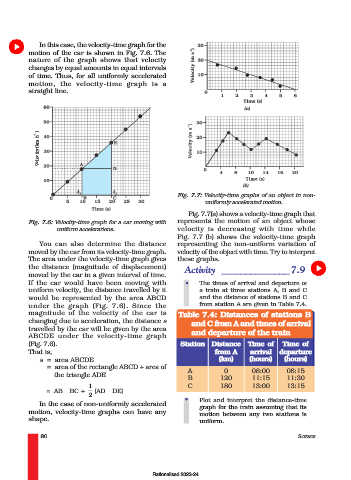
In this case, the velocity-time graph for the
              motion of the car is shown in Fig. 7.6. The
              nature of the graph shows that velocity
              changes by equal amounts in equal intervals
              of time. Thus, for all uniformly accelerated
              motion, the velocity-time graph is a
              straight line.


                –1 )
                 Velocity (km h


                                                               Fig. 7.7: Velocity-time graphs of an object in non-
                                                                        uniformly accelerated motion.
                                                                  Fig. 7.7(a) shows a velocity-time graph that
              Fig. 7.6: Velocity-time graph for a car moving with  represents the motion of an object whose
                       uniform accelerations.                  velocity is decreasing with time while
                                                               Fig. 7.7 (b) shows the velocity-time graph
                 You can also determine the distance           representing the non-uniform variation of
              moved by the car from its velocity-time graph.   velocity of the object with time. Try to interpret
              The area under the velocity-time graph gives     these graphs.
              the distance (magnitude of displacement)           Activity ______________ 7.9
              moved by the car in a given interval of time.
              If the car would have been moving with             •    The times of arrival and departure of
              uniform velocity, the distance travelled by it          a train at three stations A, B and C
              would be represented by the area ABCD                   and the distance of stations B and C
                                                                      from station A are given in Table 7.4.
              under the graph (Fig. 7.6). Since the
              magnitude of the velocity of the car is          Table 7.4: Distances of stations B
              changing due to acceleration, the distance s         and C from A and times of arrival
              travelled by the car will be given by the area       and departure of the train
              ABCDE under the velocity-time graph
              (Fig. 7.6).                                       Station   Distance    Time of    Time of
              That is,                                                     from A      arrival  departure
                 s = area ABCDE                                             (km)      (hours)     (hours)
                    = area of the rectangle ABCD + area of        A           0        08:00       08:15
                      the triangle ADE
                                                                  B          120       11:15       11:30
                                  1                               C          180       13:00       13:15
                    = AB × BC +    (AD × DE)
                                  2
                                                                 •    Plot and interpret the distance-time
                 In the case of non-uniformly accelerated
                                                                      graph for the train assuming that its
              motion, velocity-time graphs can have any               motion between any two stations is
              shape.                                                  uniform.

                  80                                                                                  SCIENCE


                                                       Rationalised 2023-24